
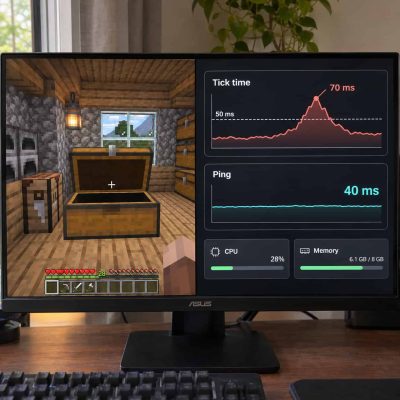
 You join a server you found on Minecraft Menu. A chest takes two seconds to open, players snap backward, and mobs stop moving. Players may call all three symptoms lag, but the delay can come from different places. A slow connection can hold up messages between a player and the server. A server that takes too long to process a tick can slow the world for everyone. To tell the difference, record ping, tick times, CPU usage, and memory usage during the same incident.
Capture Metrics While Players Feel the Lag
Ask affected players when the lag started, who noticed it, and what they were doing. Write down the player count and any activity that might explain a spike, such as several people exploring new terrain at once. Capture a quiet period too so that you can compare the numbers under different loads.
On a Paper server, use Spark to collect performance data. Paper has bundled Spark since version 1.21. Run /spark health for a live overview and /spark ping –player <username> to check an affected player. Use the host dashboard for system metrics that your server report doesn’t show, such as CPU activity by core.
Use Ping to Check the Connection
Ping measures round-trip time in milliseconds. Compare an affected player’s ping with their own usual reading and with a player who can still interact normally. Someone who usually sees 40 milliseconds but jumps to 250 when the lag starts has a connection symptom worth investigating. One high reading taken after the problem passes tells you less than repeated spikes that line up with the complaints.
If one player’s ping jumps while tick times stay steady and everyone else plays normally, start with that player’s connection. Ask them to try Ethernet or pause a large download and see whether the spikes stop. If players on different networks report a simultaneous jump while tick times remain steady, check the server host’s network status or any proxy the players connect through. Ping helps identify who is affected and when, but it can’t pinpoint exactly where a connection slows.
Read Tick Times Alongside TPS
Ticks per second, or TPS, tells you how often the server updates the world. At the usual target of 20 TPS, each tick has a 50-millisecond budget. Milliseconds per tick, or MSPT, tells you how long the work actually takes. A server averaging 20 MSPT has room for more work. If ticks consistently take 70 milliseconds, the server cannot sustain 20 TPS.
Look at spikes as well as averages. A healthy minute can include a few slow ticks that make players notice a brief freeze. On Spark, run /spark tickmonitor –threshold-tick 50 to flag ticks that exceed the budget. If several players see mobs freeze at the same moment that tick times spike, investigate what the server was processing then.
Compare CPU Load With Slow Ticks
Check Minecraft’s CPU usage alongside the host’s overall CPU usage. A machine can show a modest overall percentage while a single core is busy. On a conventional Paper server, work on the main server thread can hold up a tick even when other cores have room. If slow ticks coincide with high CPU activity, run a Spark profiler during the slowdown and inspect the report for the work taking the most time.
For example, if tick times climb as players explore and the profile points to chunk generation, compare a session in explored terrain with one in new terrain. If total host CPU rises while Minecraft’s own usage stays steady, check what else runs at that hour. A scheduled backup could compete for resources.
If tick times are high and CPU usage stays low, look for work that spends time waiting. Check whether slow ticks line up with world saves or backups, then compare disk activity and the profiler report before upgrading to a larger hosting plan.
Look for Memory Pressure and Garbage Collection Pauses
On a Java server, distinguish the Java heap, where objects are stored, from the total memory used by the process or host. Heap usage often rises as the server creates objects and drops as garbage collection frees space. Watch for long or frequent collection pauses that coincide with freezes, or a heap that repeatedly stays near its limit after collection. A high reading by itself gives you little reason to add RAM.
If collection pauses match the slow ticks, check what the server was doing when memory use grew. Compare busy and quiet periods, and note whether memory settles after the activity ends. Also check how much memory the host or container has available before increasing the Java heap.
Verify the Cause With One Change
Change one thing that matches the evidence, then repeat the same activity with a similar player count. If a plugin dominates a slow tick profile, test a configuration change for that plugin and compare the new tick times. If changes to a player’s connection lower their ping while tick times stay steady, ask whether chest interactions or movement improved too. Save both sets of readings so you can tell whether the fix holds the next time the server gets busy.